These are all very familiar concepts nowadays. You probably hear them a lot and can imagine how IT giants like Google or Facebook use these state-of-the-art technologies. But maybe you haven't yet come across a practical concept that fits your business. In the next few paragraphs, we'll re-introduce these concepts and look at a few real-world, universal examples that might work for your business.
 Figure 1 - Data Science concept by Oguz Kayra, source: https://mymasterdesigner.com/2020/12/29/data-science-exercises/
Data Science is, in short, a field combining mathematics, IT and business knowledge to extract knowledge from structured (e.g. financial numbers from SAP) and unstructured (e.g. OCR, or information extraction from text) data. These relationships are best summarised in the following figure.
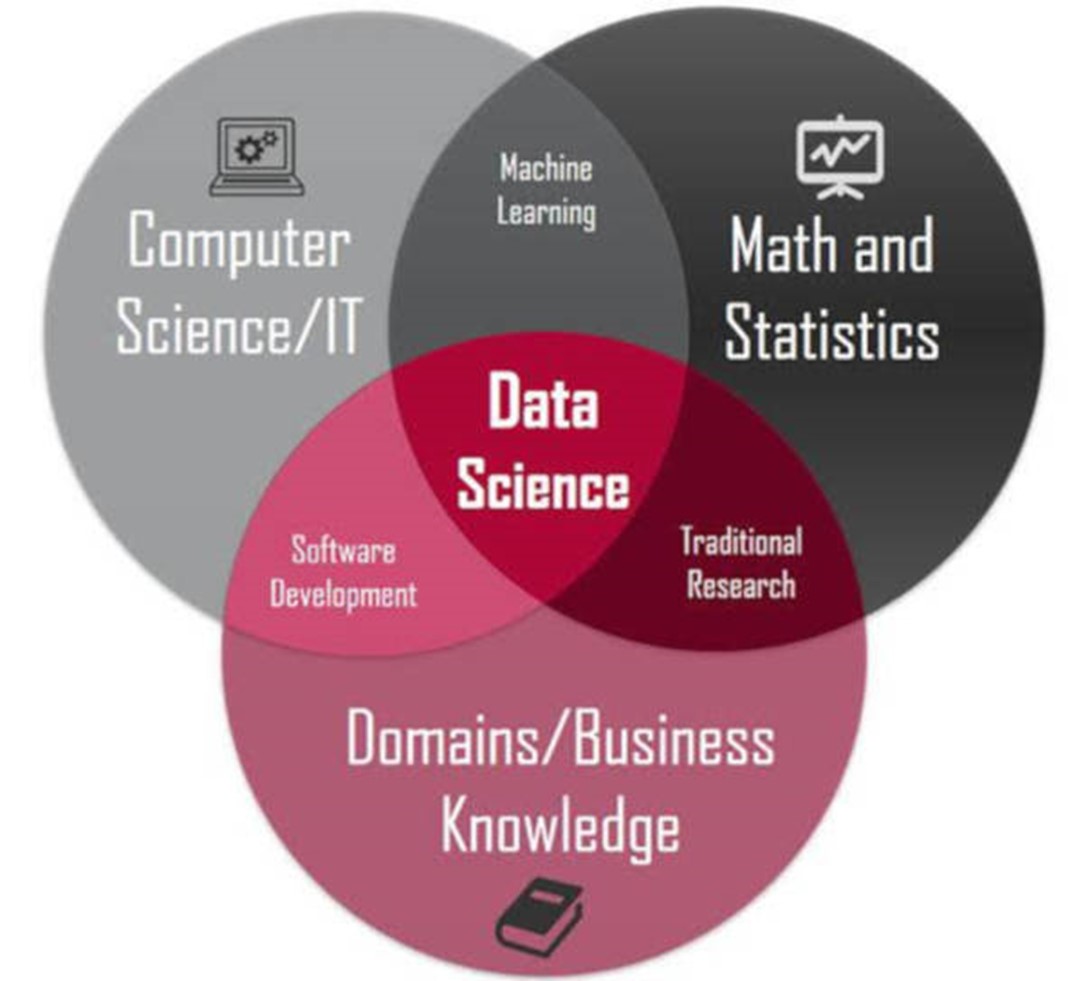
Figure 2 - Data Science concept by Mojeed Abisig, source: https://www.kdnuggets.com/2020/08/top-10-lists-data-science.html
As you can see in the figure below, between Computer Science and Mathematics and Statistics is Machine Learning, or machine learning. By this term, at this point, think of a set of methods and tools that you use to solve some of your Business Data Processing requirements. For example, you need to figure out if you as a bank should lend money to a client based on the data they provide and historical data on similar clients. You create a mathematical model (e.g. Logit model) that calculates the probability that a given client will default on the loan based on this data. So the machine (computer) has learned to classify clients based on the data presented => Machine Learning.
But what are some other different practical examples that can be used across different sectors?
- Correlation and regression analysis are basic statistical tools for evaluating the relationships and impacts between selected indicators. The most common use is to estimate/simulate how an indicator will change in response to a change in another indicator (e.g., how sales will increase if we lower the price of a product). More on this topic can be found, for example, at [1].
- Shopping cart analysis is a data mining tool for obtaining information about the composition of individual customers' shopping carts. Let's say we have a checkout system that digitizes every transaction/receipt from a purchase and based on this data, we can mine the data to see what products customers buy most often together. E-shops can use this analysis to create a recommendation engine that will suggest additional items to purchase based on the items in the cart. Stone stores can use this information to, for example, schedule the placement of items in the store. Another use can be, for example, to create campaigns. More can be found, for example, at [2] or [3].
- Every company that markets its products is faced with product pricing. How to set the price of the product to match the current state of the market, the time of year or the competition? This is probably the daily bread of every marketing/sales department and product manager. But why go through the whole decision-making process manually when there are tools available today to make the process easier, more accurate and faster? For starters, when using machine learning for pricing, we need to provide the data we use to determine the price. Historical price trends for a given product and its corresponding demand, weather, season, competitors' prices for the same product, special events/holidays, macroeconomic indicators, and much more can all enter the model. These inputs are then used to build a model that dynamically predicts what would be an appropriate price for the product given the chosen strategy. More can be read, for example, at [4].
- Predictions and planning can be found everywhere today. Everyone wants to know what will happen tomorrow, next week, next month or next year. No one knows the future, but we can plan for future developments with some probability based on historical development and experience. However, manual planning is very time consuming and prone to human error. However, if certain assumptions are met, we can use various statistical models, which have advanced greatly in the last decade. The most important prerequisite is, of course, a well-prepared and maintained database. If we are able to create a time series from the data and also have other variables that influence the development of the time series, we are able to select an appropriate model according to the nature of the data and predict the future development of the indicator in question. This consequently eliminates a lot of manual work and human errors. Predictions can be used as a building block in making a plan, or to check predictions against a plan. For example, it is very common in companies to predict sales, revenues, expenses and losses. With these models, we can anticipate an event that is yet to occur (e.g. high losses due to heavy rains) and better prepare and react to it. You can read more reasons why forecasting is important, for example here [5].
- Finally, we should also not forget the area called Data Mining. Data mining, in short, deals with mining interesting relationships from data. For example, we can imagine a situation where we have a large database of data that can no longer be analyzed manually in Excel or BI tools and we need to use more robust methods and tools to analyze it. For example, we may be interested in why customers are not buying our products as they did last quarter. Based on the submitted data and the chosen algorithm, the tool will scan the data and, for example, find out that the rating of the product has decreased and, with the involvement of the NLP (Natural Language Processing) algorithm, we are even able to extract the reasons for the low rating. We can then use this information to customize the product to the customer's needs. Another example of data mining is also the aforementioned shopping cart analysis. More information and examples on this topic can be found at [6].
Similar examples abound and it is impossible to list them all in one article. But what these examples have in common is that they all help companies in their decision making, save time and costs and often lead to increased sales. The ability to work with data, as you will recognize, is an integral part of almost every business in today's digital world, and SAP tools can help you in this regard.
If you are interested in our article and would be interested in a consultation on the use of some of these methods in your company, please contact us and we will arrange a joint meeting.
Zdroje:
[1] https://www.researchoptimus.com/article/what-is-correlation.php
[3] https://searchcustomerexperience.techtarget.com/definition/market-basket-analysis
[4] https://www.appier.com/blog/what-is-a-recommendation-engine-and-how-does-it-work/
[5] https://www.baass.com/blog/why-forecasting-is-important-for-business-success
[6] https://www.getapp.com/resources/what-is-data-mining-small-business/